Most (but not all) of the variable stars I tried over the past month or so were simply too bright for this sensor. The target stars were saturated (ie some of the pixels’ electron wells simply overflowed) despite using the shortest available exposure, adding the light pollution filter and refocusing. Seestar won’t let your change the ISO nor open the shutter for less than 10 seconds.
I did get some believable light curves on BE Lyncis (aka HD67390)and U Cephii (aka HD 5679). I attack some graphs I made.
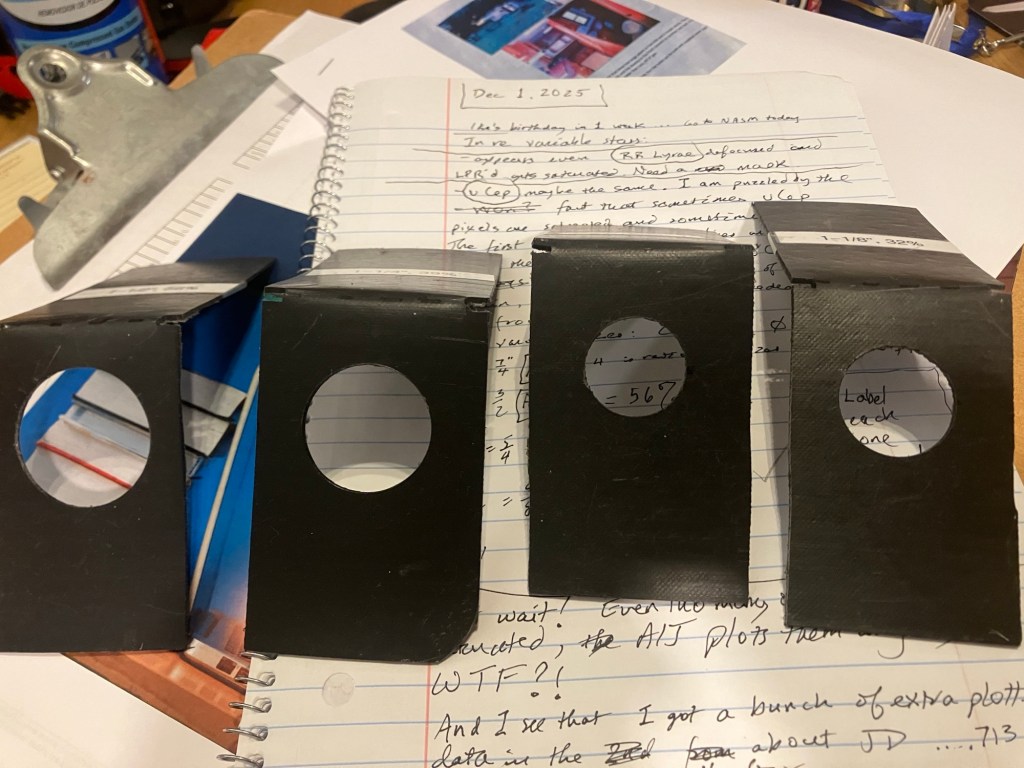
I used some black plastic I had,and my set of Forster bits, to make holes of sizes 1”, 1-1/8”, 1-1/4”, and 1-1/2”, in case I want to try brighter variable stars again like RR Lyrae.
I very impressed that Seestar absolutely nails the locations of every single one of these targets! I’m also pleased that AstroImageJ allows quick and easy plate-solving!
I’m still struggling to do simple astronometry even on a well-known variable star like RRLyrae. If you could measure its brightness for several nights without any breaks, you should in theory get a light curve like this:
I don’t. I’m still trying to figure out why my light curve for RRLyrae is so flat.
In 2004, during a two-week astronomy summer class at Mount Wilson, with a professional astronomer on hand guiding me at every step of the way over a couple of nights, I got light curves looking like pieces of the good example above. (Why only pieces? Because you can’t image a star in the daytime or when it’s cloudy or if the star is on the other side of our planet!)
A couple of weeks or so ago, inspired by an exoplanet light curve taken by a 9th grader with a Seestar, I had the opportunity to run my tiny automated Seestar S50 for 8 hours outside at Hopewell Observatory, which is a nice, safe location, connected to wall power. The weather was perfect for it. The scope is about the size of a large cookie tin on a tripod. It did nothing but take ten-second photos of a small region around RRLyrae from whenever stars came out until dawn.
Afterwards I then had to start analyzing those 972 images. My first step was to learn how to use YET ANOTHER astro-imaging package, called AstroImageJ. It’s quite impressive, but It pisses me off that every few years I have to learn an entirely new piece of software, and just throw out nearly everything I learned regarding anything software-related over the past 60 years!
I eventually figured out how to get AIJ to verify that the little scope was in fact looking at my chosen star — and it was.
I then asked AIJ to compare the brightness of RRLyrae to the brightness of five or six other stars of similar brightness that happened to be located in the same field of view, for each image. (Today’s computers quickly do all sorts of math on the values of certain pixels in certain rings around certain stars, at lightning speeds, but the human computer of 1899, Williamina Fleming, who discovered this star, had to do it completely manually by comparing the size of the spots on a glass photographic plate. My hat is off to you, Ms Fleming, and all the other unsung female computers!
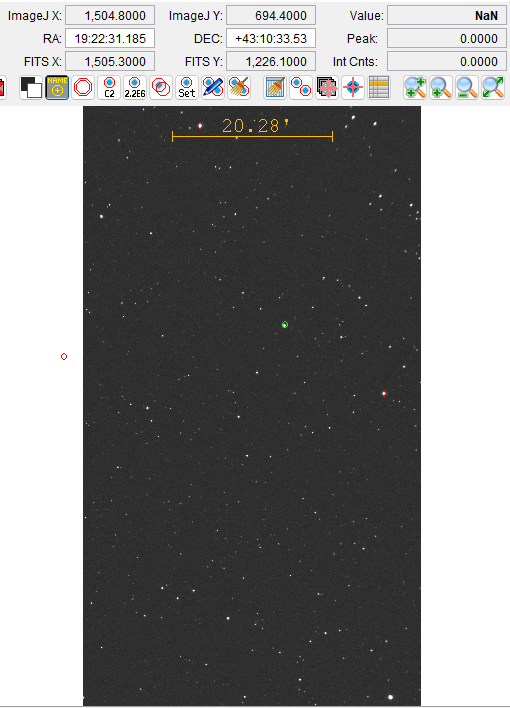
Here is a screenshot of the very last image in the series I took. The RA and Dec are the coordinates of RRLyrae, which AIJ has circled in green. The stars circled in red are comparison stars. That 20.28′ legend is in arc-minutes, 60 of which equal one degree. So the field of view is a bit over half a degree across and roughly a degree vertically.
To my surprise, my results were totally different from what I expected to find.
The blue dots are RRLyrae’s brightness on some scale that the computer cooked up, and the pink ones are from one of the known comparison stars. The x-axis goes from roughly 0.48 to 0.64, or 0.16, which is 1/6 of a day, or 4 hours.
The cases where both the blue and pink dots drop down below 1.0 are garbage caused by some glitch and should be ignored. But one thing is for sure: there is no sawtooth spike in my data for RRLyrae’s brightness during those 8 or 9 hours!
Four possible reasons are:
I’ve made a great scientific discovery! (probably not correct)
2. Wrong star? (I don’t think so. Checked and re-checked)
3. Perhaps those 8 hours happened to correspond to a flat place in the light curve (Possible — I just noticed that these images end before midnight, but I thought it kept working until dawn! Must re-check!)
4. The pixels all are too saturated, ie were exposed for too long,, which fills up the pixel with too many electrons. (This is possible, I guess, but each of these were merely 10 second-long exposures, which doesn’t sound very long to me, but maybe I’m missing something important).
Saturation is what the following graphic seems to indicate:
If it is indeed saturation that is making all the stars not change brightness, then what do I do?
I don’t think I can control the gain or ISO inside SeeStar, but I can ask for shorter time exposures, I think, by trying a time lapse and asking for shorter exposures, if possible. I just need to have time and a location to let it run all night without anybody disturbing it, making a time lapse of the sky.