Very weird: on an old Coulter mirror that we tested tonight, a green LED reflected back at us as **red** light instead of the normal green.
We don’t understand! Green LEDs have a wavelength of roughly 525 nanometers, give or take 30 nm. Red LEDs are about 100 nm longer. How can something that otherwise looks like a normal aluminum coating shift green light all the way to red light?
Inquiring minds would like suggestions.
The first two rows of green images are from a different old Coulter mirror that we also tested, that very same evening, with the same focal ratio, and the same apparatus. The last row of red images that we took of the weird Coulter-ish mirror that I wonder about.
UPDATE: July 18, 2026
There may be a solution to this mystery. Preston Engebretson wrote me on Facebook:
“The coating responsible is likely a standard Aluminum coating with a Silicon Monoxide (SiO) or Silicon Dioxide (SiO₂) protective overcoat that has degraded or contains specific impurities, causing it to exhibit fluorescence (photoluminescence). The Phenomenon: When a Green LED (wavelength ~525 nm) is shone onto the mirror (e.g., during a Foucault or Ronchi test), the reflection appears Red instead of green. The Coating: Coulter mirrors typically used Aluminum with a Silicon Monoxide (SiO) overcoat. Silicon Monoxide (or silicon-rich silicon oxide, SiO_{x} is known to exhibit red photoluminescence under certain conditions, particularly if silicon nanocrystals form within the oxide matrix due to aging, annealing, or specific deposition defects.”
A quick search with Bing and Copilot led me to a paper describing how engineers and scientists have recently been able to harness this photoluminescence to produce reflected light in wavelengths ranging all the way from ultraviolet through red! I never knew!
My guess is that this mirror at some point got very, very hot, and the silicon monoxide overcoat changed in part into a mixture of pure silicon crystals and silicon dioxide, causing the red photoluminescence that we saw. A quote from that paper:
This time I attempted to detect a different transit of another star using two different setups on the grounds of Hopewell Observatory in northern Virginia.
A Canon 6D DSLR mounted on a big, heavy 14-inch Schmidt-Cassegrain telescope on a very sturdy AP1600GTO equatorial mount
An alt-az Seestar S50 all-in-one astro camera
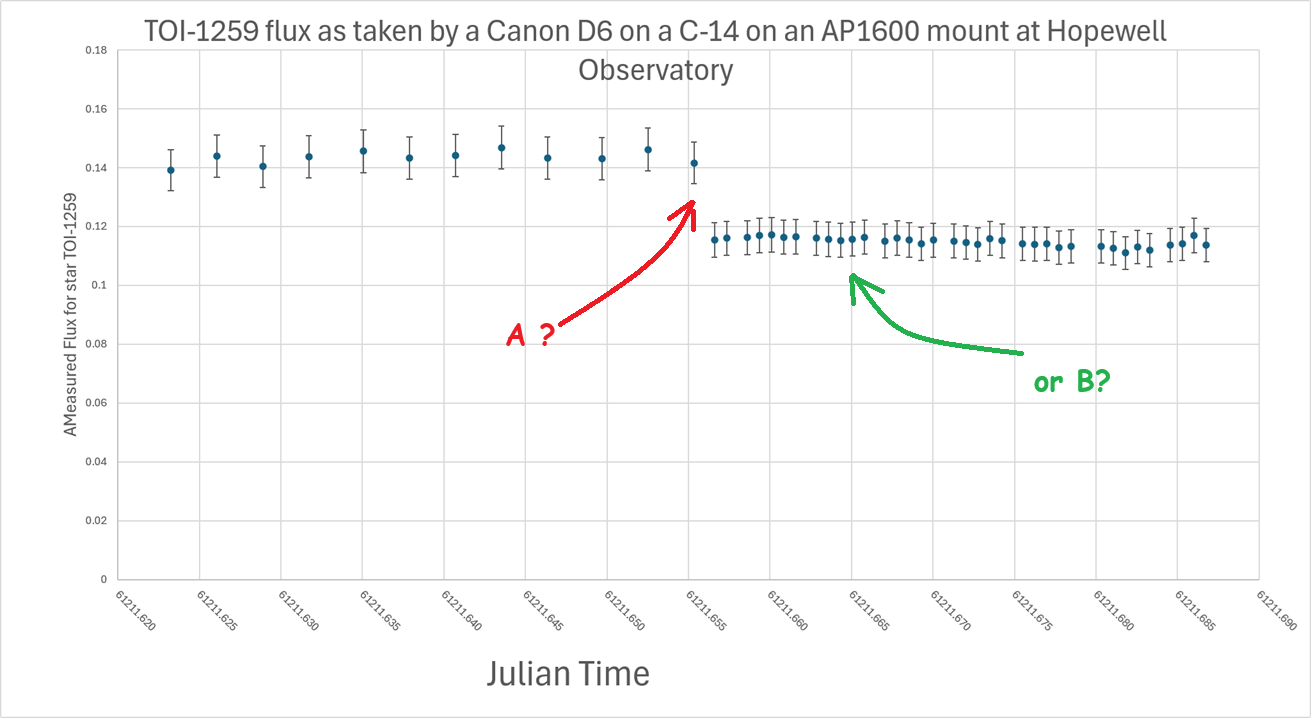
Can you spot where the exoplanet TOI-1259-b dimmed the light from its host star?
(Hint: this is a trick question!)
Here are the graphs I made from the data I collected:
Was it at A? Or did it happen at B? (Trick question!)
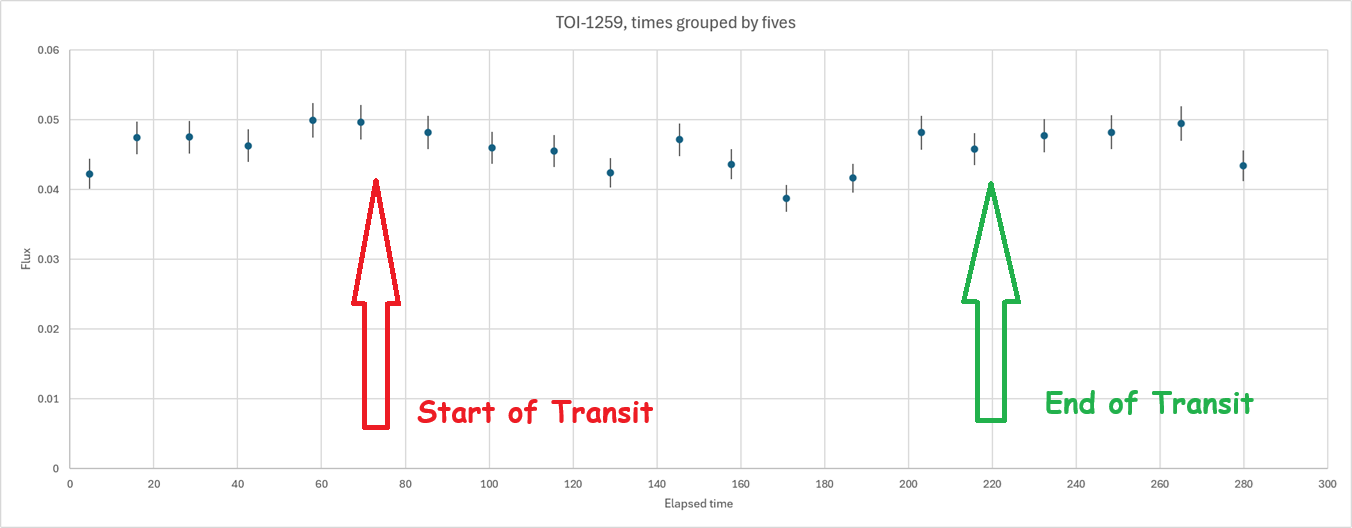
And this graph is what I got from my SeestarS50:
Psst:
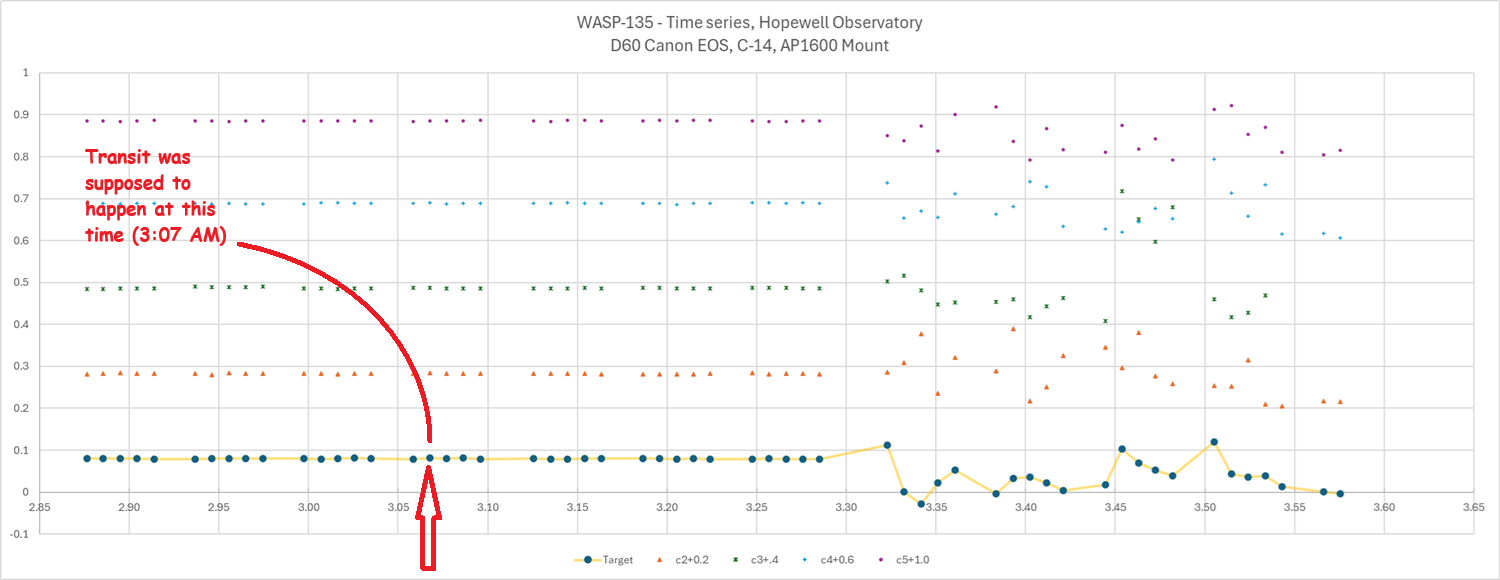
Point A in the first graph was when I reduced the exposure time on the camera from 2 minutes to 30 seconds. That caused all of the fluxes to decrease, because cutting the time by 4 reduces the number of photons captured. Arrow B points to where the transit was supposed to happen, with a 2.7% decrease in brightness.
Do you see it?
Me neither.
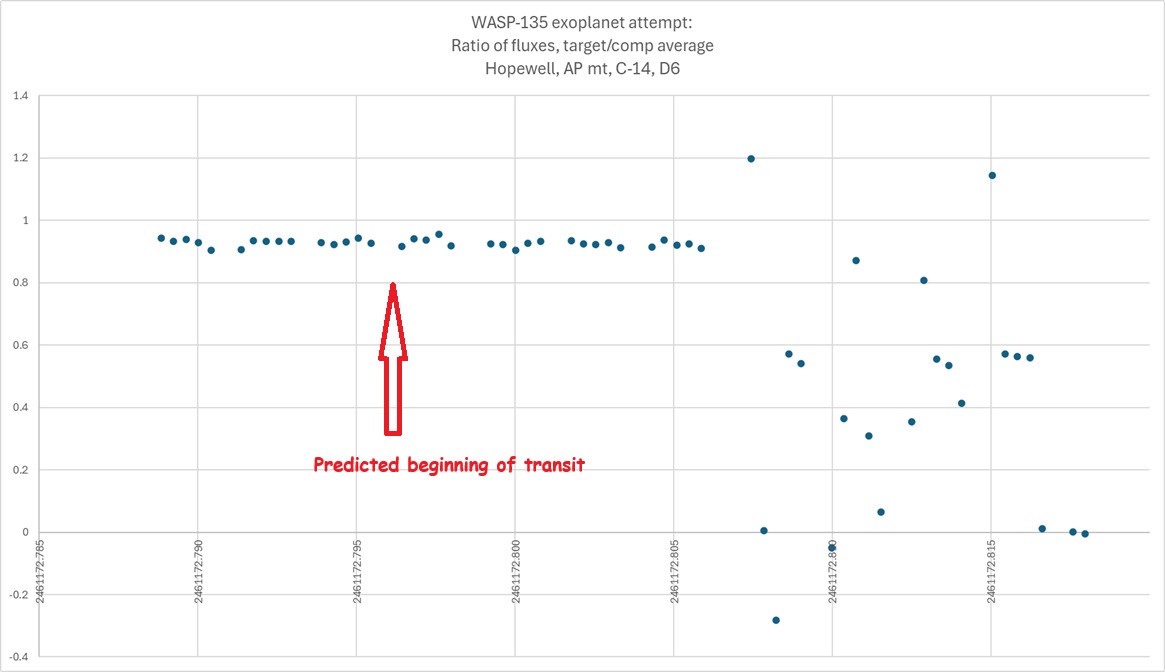
In the second graph, done by the Seestar at the same location on the same night, smoothed as much as I can by averaging successive images, I again don’t see much evidence of a 2.7% dip in total flux.
Conclusion: chasing exoplanet transits looks like it could be easy, but it’s not.
===============
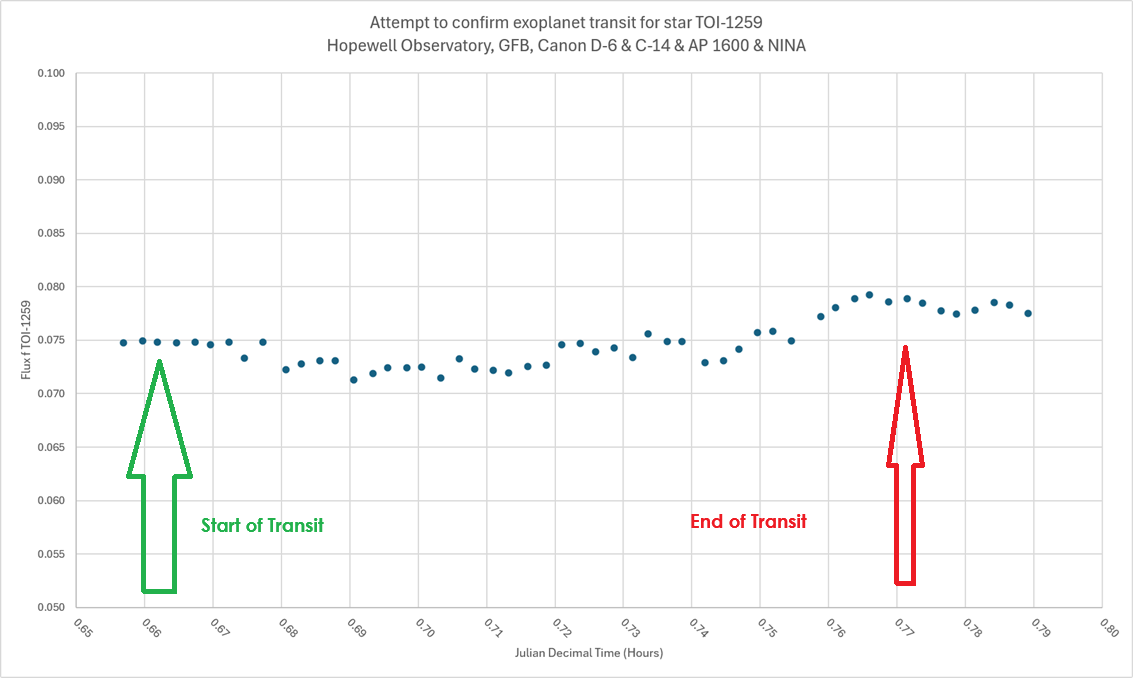
This graph here is no better.
And here is where I extracted just the two green channels:
No, I am not at all convinced that my measurements captured anything.
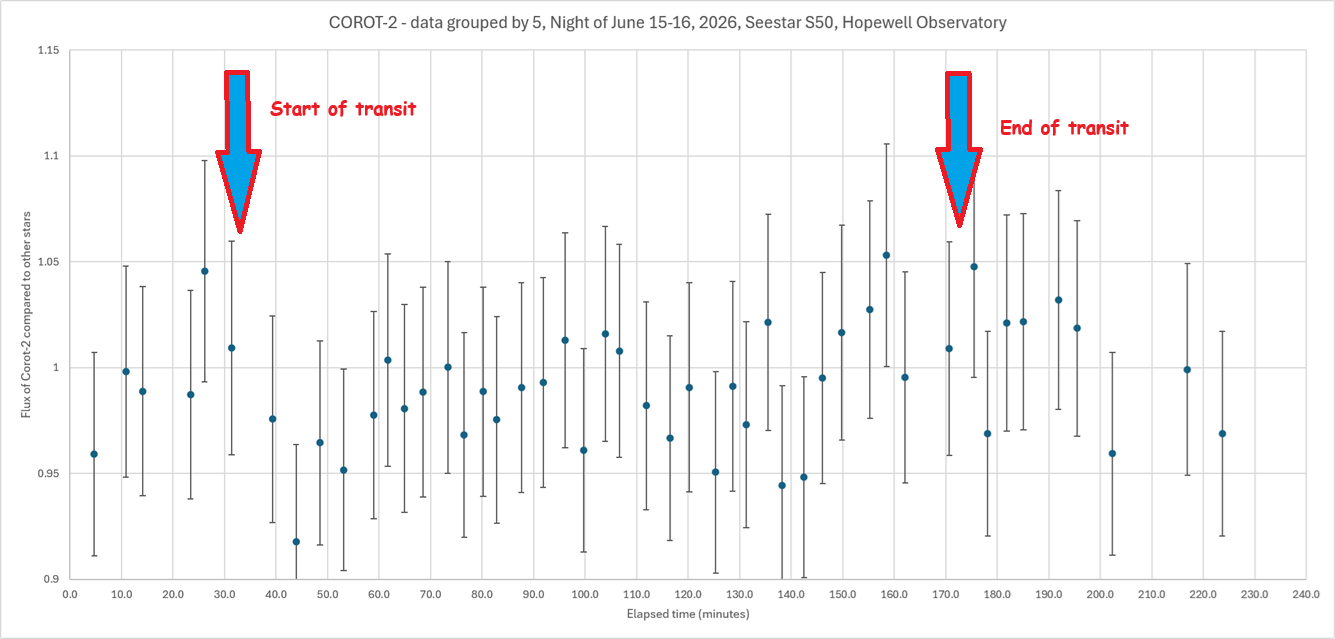
Do you see a transit in this data? I would say, “Maybe”.
Since the Seestar has quite a bit of error, caused in part by its Bayer array of green, red, and blue pixels, I grouped my original measurements (processed in AstroImageJ) in groups of 5, using Excel to do so.
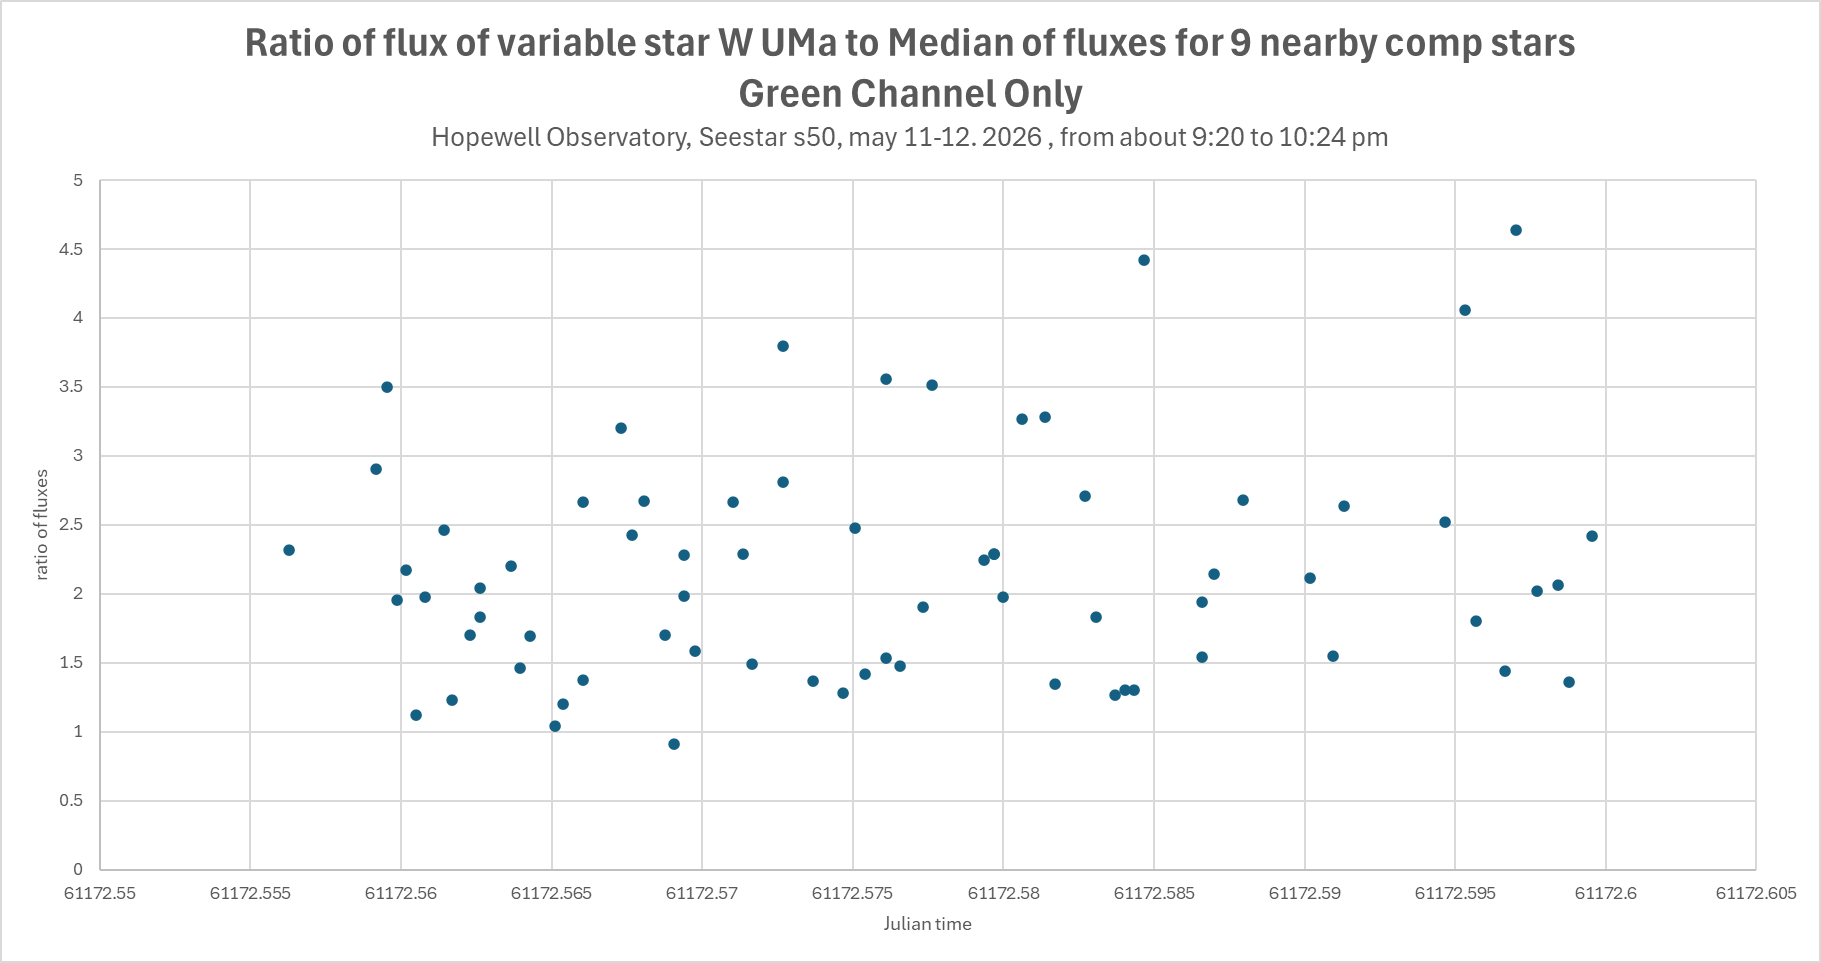
Latest results on a known variable star, W Ursae Majoris with my Seestar S50 during a very nice night: complete garbage. The graph below shows the flux of my star, WUMa, compared to the median of 9 comparison stars in the same frame, chosen by AstroImageJ.
As you can see, there is no real pattern.
If this data were real, then this star would be changing its brightness by a factor of three or for in less than a minute, with no discernable pattern. While a candle flame will flicker like that, it is simply not possible for something as large as a star to vary as quickly as that. In fact, this star is actually a contact-binary (double star) with a rotational period of about 8 hours. Even with the noise, I see no sign of a trend over these two hours.
The weather was very good, there was very little light pollution, and this star was quite high up in the sky the entire time, and none of the stars were saturated. But this data is just so, so noisy.
(I used ASTAP and AstroImageJ to do the plate solving and comparison of brightnesses. AIJ is an absolutely amazing program that automates so much of the tedium of this sort of process. For this graph, I had AIJ extract the green channel from the GRGB Bayer pattern, hoping that eliminating the blue channel would reduce atmospheric problems, but no luck so far. Combining all channels was no better.)
Other people claim success, but so far I’m zero for 12 in detecting exoplanet transits, and only 1 out of a dozen or so variable star measurements. Not sure what I am doing wrong or how I can reduce the errors. Yes, it’s true that this is only 2 hours out of an 8-hour period, but this data does not make any sense!
As you probably have guessed, detecting exoplanets is not easy.
So far I am about zero detections for 12 attempts.
My equipment has been a Seestar S50, and either a ZWO CMOS camera on an Explore Scientific 5″ f/7 triplet refractor, and a Canon 6D DSLR affixed to a venerable C-14 mounted on an Astrophysics 1600 GTO mount.
The Seestar is able to detect brightness changes in other variable stars like RRLyrae, but so far the small changes in flux from exoplanet transits gets drowned in the noise. The DSLR on the C-14 has much less noise, but I still haven’t seen any clear and obvious signs of a transit.
Here are graphs from my latest attempt at detecting WASP-135-b. In the first one, I plotted the fluxes of that star against four of the comparison stars. I added a fixed number to the fluxes of the other stars so you could see trends more clearly. Shortly after 3:30 AM, measurements became very strange for every single star. I was asleep at that time. I’m guessing that there were clouds. Do you see any noticeable dip in brightness of the target star at 3:07? I sure don’t.
In the second graph, I asked Excel to take the average of the fluxes of several of the comparison stars, and then divide the flux from WASP-135 by that average. Again, I see no dip at the appropriate time (Julian Day).
I used NINA to program my cameras and the Hopewell Observatory’s AP mount to take these images. I used ASTAP and AstroimageJ to load all of the images from my various cameras, figure out exactly where the cameras were pointing (aka plate solving), find a bunch of comparison stars, and then measure the fluxes of each of those stars, on each and every single 30-second frame. That set of software — all free!!!– has made all of this work much easier. Thank you to all the incredibly smart and generous people who wrote, and then made freely available, all those complicated computer programs!
I will try TOI-1811 tonight, with some different settings.
We can perhaps defend against them with a high-flying scientific PUNCH!
(Pun intended. Sorry.)
NASA’s PUNCH mission is flying and is beginning to take polarized 3D images of the interaction between the Sun’s Corona and the heliosphere – to help us predict when our closest star is about to ‘go crazy’ and send so much energy our way as to cripple our power grids or our global networks of communications satellites.
We will hear about the mission during the monthly April National Capital Astronomers meeting this Saturday, 4-11-2026, starting at 7:30 sharp.
There will be a bit of club business first, then a talk about PUNCH by Dr Michael Kirk, a NASA – Goddard Space Flight Center scientist, followed by telescope observing at and around the University of Maryland’s observatory under what is predicted to be nice clear skies.
If you like, you may bring your own telescope to set up on the pads outside on the observatory grounds, to share views with others. I plan to bring one of the scopes that I made, and I hope we can draft somebody to keep an eye on them during the meeting.
To drive to the meeting in person, aim your GPS at “UMD Observatory” or type in 3255 Metzerott Road, College Park, MD 20740. The inconspicuous entrance sign is on the south side of the road. Public transportation to the location is unfortunately not reliable.
If you want to join us remotely, here is the link: UMD-NCA-Zoom-Link or you can try
Are you one of the lucky ones who have seen the enormous solar corona during a total eclipse?
Have you seen the Northern or Southern Lights?
These gigantic structures change like our own weather. If you fly near the Arctic or Antarctic circles at night you can see the aurorae just about any time, but the solar corona itself only becomes visible to us on Earth for a few fleeting minutes during a total solar eclipse.
There is a lot that is still unknown about the solar corona — and how it affects the solar winds and the heliopause that protects us from most nasty interstellar radiation. As you probably know, all these connected phenomena influence the Northern lights, can play havoc with radio communications and satellites, and have in the past occasionally knocked out all electricity to large parts of North America and other locations. Larger solar outbursts could conceivably disable every single global communications satellite system, without which modern civilization would largely crash to a halt.
NASA science missions like PUNCH don’t get nearly as much publicity as crewed missions like Artemis. But they also cost a whole lot less, and when they work as planned, they get better data.
(Compare the photos of the backside of the Moon made just now by the Artemis crew (with their cell phones) with those made by the unsung Lunar Reconnaissance Orbiter, LRO, which has been orbiting the Moon ever since 2009 and taking very high-resolution photos in lots of wavelengths. LRO not only has detected all sorts of chemical variation on the Moon’s surface, including signs of water ice, and has even sent back images with very clear tracks and rocket blast marks left behind by the Apollo astronauts over 50 years ago!)
These two images are of the same location, Vavilov Crater.
The photo from the LRO is incomparably more detailed.
Our speaker, Dr. Michael S. Kirk, is a Research Scientist in the Heliophysics Science Division at NASA’s Goddard Space Flight Center. He plans to explain to us the status and goals of NASA’s PUNCH constellation of four small satellites in low Earth orbit.
Using polarimeters, the craft are supposed to be making global, 3D observations of the entire inner heliosphere to learn how the Sun’s corona becomes the solar wind that comes our way.
PUNCH stands for Polarimeter to UNify the Corona and Heliosphere.
NCA is a 501c3 educational and charitable non-profit, and all of our meetings are free and open to the public. Our website is capitalastronomers.org
I’ve captured some variable stars, both with somebody figuratively holding my hand at almost every step of the way, 22 years ago, at a 2-week summer session at Mount Wilson that I highly recommend, and also with a Seestar S50, after failing a few times.
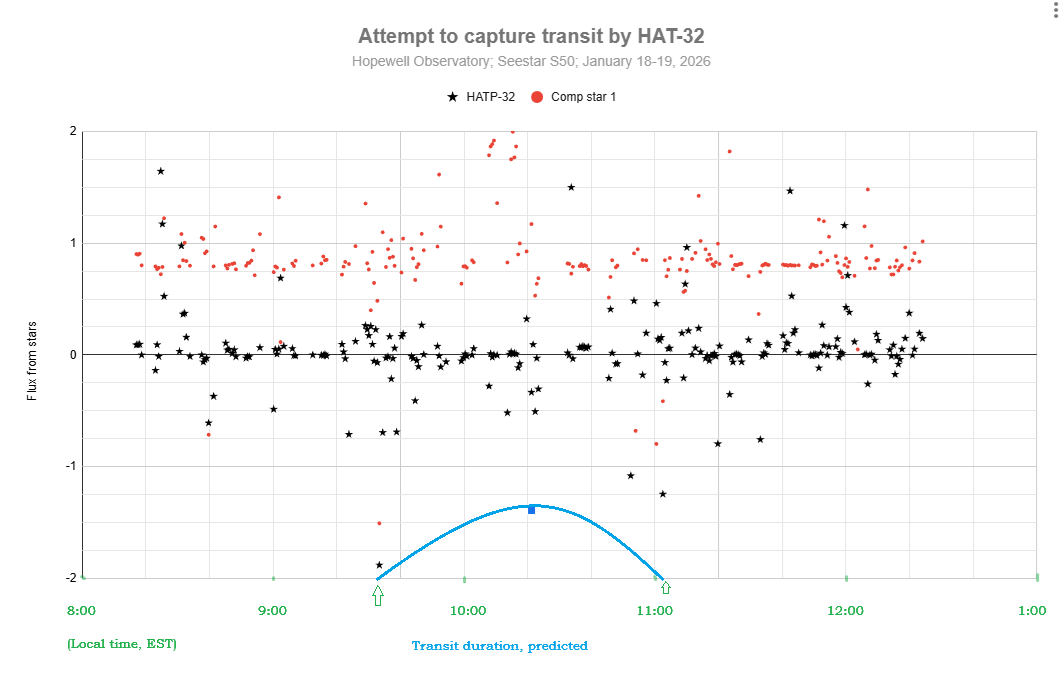
I was hoping to be able to finally capture an exoplanet transit. I tried in a couple of different ways on the night of January 18-19, but failed. Even so, I count the night as a major success.
It turned out that there were four (yes, 4!) different exoplanets that were supposed to have transits quite visible, during the same night, from my location (Hopewell Observatory in northern Virginia), and I was going to be staying up there all night anyway, with some others.
I used the Plan mode of my Seestar to take 30-second exposures of the star that looked like it would be the easiest to capture, namely HAT-P-32, which is in Andromeda at Right Ascension 02h 04m 10.00s and Declination +46° 41` 16.00″, It was supposed to have a depth of transit (or coverage of the star by the planet) of 22.2 parts per thousand, or 2.22%, which I thought sounded like quite a bit.
Unfortunately, it’s not very much at all, at least in terms of star magnitudes!
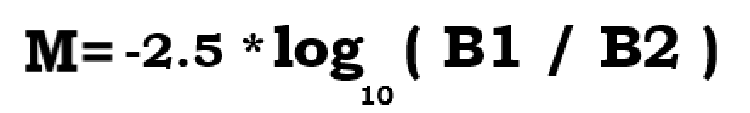
Perhaps you knew (I had forgotten it) the formula for turning brightness changes into magnitude changes.
(M is the magnitude change, B1 is the actual measured flux of photons at time 1 or from star 1, and B2 is the same flux, measured the same way, at time 2 or from star 2.)
You don’t even need to remember what a logarithm is to punch this into your calculator. I found that if you make it so that the ratio of B1 to B2 is one-half, you get a result of 0.75257… and if you try it the other way around, you get the exact same result, with a negative sign in front.
Let’s see: a drop in brightness of 22.2 parts per thousand leaves 977.8 parts per thousand still reaching my telescope. So my B1 needs to be 977.8 and B2 needs to be 1000. Or I could just type -2.5*log(0.9778) and when I do that, I get a drop in magnitude of 0.023, which is not very much at all!
Well, here is my attempt at detecting a transit for HAT-P-32b. I don’t see any sign of a transit. Do you? Part of the problem may have been that my target star was in the trees for part of the time…
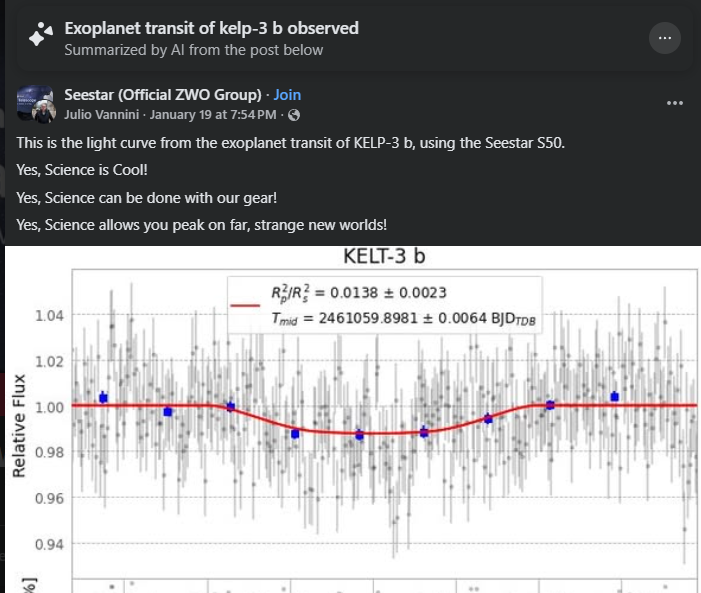
It appears that others have succeeded at this:
I will hope for better weather, better preparation of every step, and fewer tree branches next time!
By the way, here is my workflow. Steps 0 – 2 should be done at home, inside, in comfort, well before leaving for your observing site.
0. You must have both SeeStar and plate solving software (and its databases) operational on your computer. Download and install you have SeeStar, AstroImageJ, Astronometry.net and all of the databases for these accessible on your computer. You can also use ASTAP if you prefer for plate-solving, but AIJ uses Astronometry.net.
Look up which exoplanets are supposed to be visible in your area on the Swarthmore database, for how long, and in what part of the sky. Pick the best ones, with the greatest change in brightness. Print out the data.
2. Connect your Seestar to your tablet or smartphone and create a Plan to image that star for the entire time, with 30 second exposures, no filters, saving every frame. Double-check all your settings! You can do one target after the other, sequentially, but with the current SeeStar software, it doesn’t appear that you can ask it to rotate among several targets for a period of time. If you want to study variable stars, you might find that the Seestar’s pixel wells will get saturated with too many photons, which renders all your time and data is useless. To stop the saturation, set the exposures to as short as possible (10 second exposures), and set the light-pollution filter. If it’s still saturated, you might even need a sub -aperture mask to cut the signal further. You may or may not find that you have to manually change settings at various times during the night; if so, set an alarm for yourself.
3. Later, at the observing site, after sundown: Level your tripod, attach Seestar, turn it on, arrange for a power supply for it, use Bluetooth connect the same tablet or smartphone that you used to make the plan, and tell Seestar to start implementing your Plan. Check the clock and the smart device to make sure Seestar has actually started carrying out the plan. Periodically, re-check to make sure the images look decent. (I have found that Seestar is actually very good at centering your target precisely where you asked it to go to!
4. Let the Seestar do its thing. Check the image that shows up in ‘Star Gazing’ every so often. That window shows you the latest version of the stacked and calibrated image – which you won’t need for attempting to catch an exoplanet transit — not the current sub-exposure.
5. The next morning, in comfort, use a USB-C cable to connect your Seestar to a computer. Use a finder to locate the My Works folder on the Seestar, and find the folder that has all of your subs (frames). They should be in ASIF format. If you like, you can upload them to your computer, or else you can leave them on the Seestar. Take your pick.
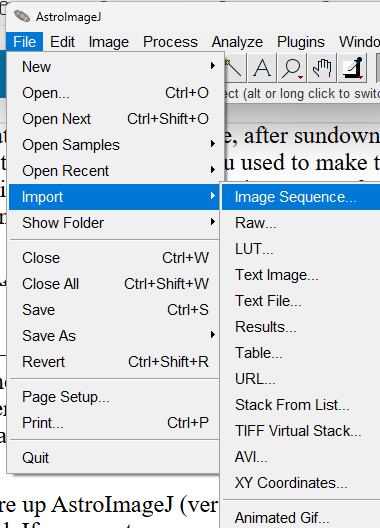
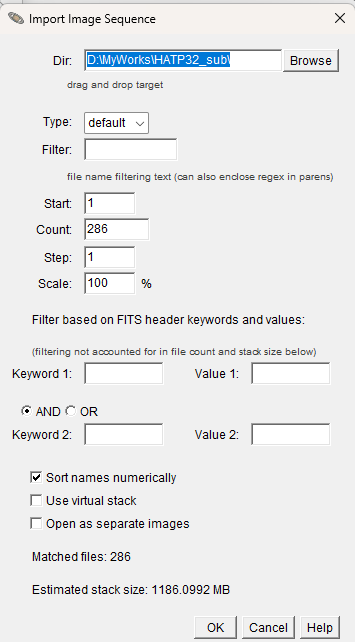
6. Fire up AstroImageJ (version 6) on your computer. Use File/Import Sequence to load that same sequence of subs that you just found. Keep in mind that some parts of the process (especially plate solving) might tie up your computer for a long time, perhaps hours. I would suggest only importing every 10th sub, to begin with, to find out if the whole stack of images is garbage or useful. If desired, you can always import the entire stack later. If I change the Step to 10, it will instead load image #1, then #11, then #21, and so on…
6. Inspect the images, and make a note of the ones you think are garbage. Get rid of those subs.
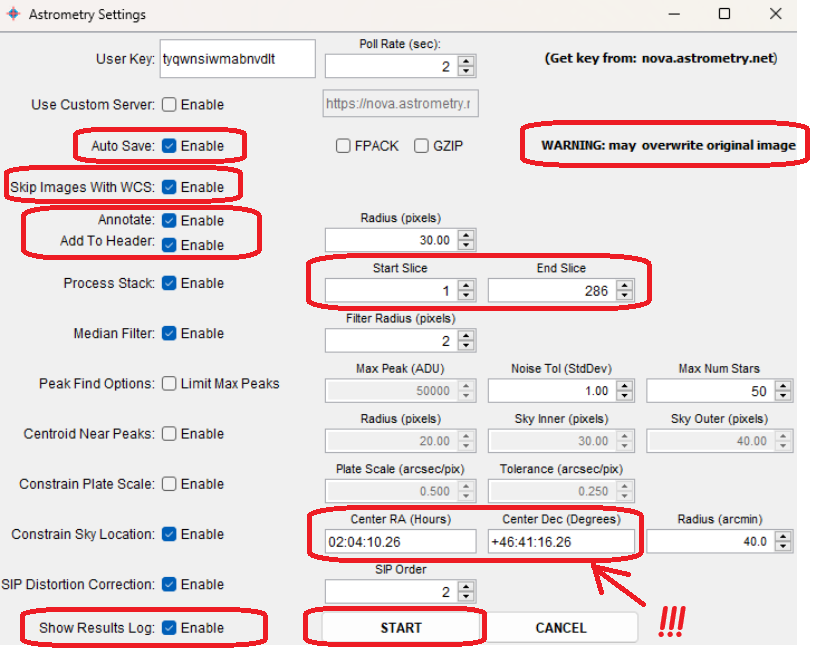
7. Then have AIJ do a plate-solve by chosing WCS (World Coordinate System) then Plate Solve with Astronometry.net (With Options). One of those options should be the coordinates of your star, which you should type in manually. You will need an Astronometry.net user key. You may use mine if you want: tyqwnsiwmabnvdlt. Make sure that Autosave and Skip Images With WCS are Enabled. When you have all that done, click on ‘Start’.
AIJ and Astrometry will then do their best to figure out exactly where the image was in the sky, and will record the RA and Dec of every single object in it and add that to the FITS header. AIJ&A will also indicate which are the cardinal directions. Hopefully, they will be able to solve every image. If Astrometry.net fails, you can try doing the same thing with ASTAP instead, which is insanely fast.
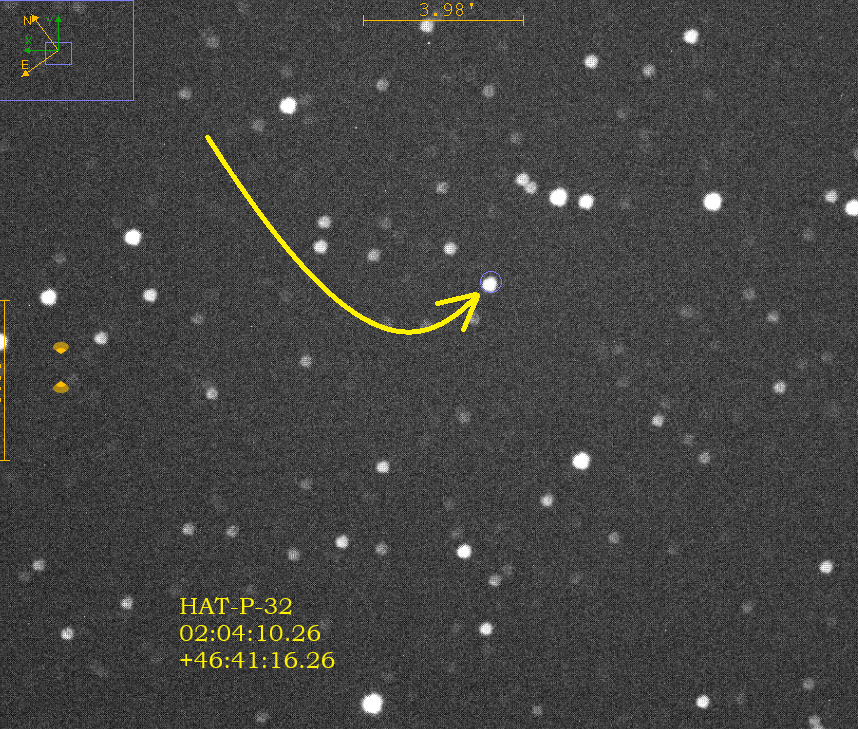
8. Once all of your images have been plate solved, then enlarge one of the images and find your star by checking the coordinates very carefully by moving your mouse around on the image. Since your image has been plate-solved, AIJ now knows exactly how to match the pixels on your screen to the coordinates in the sky, which is extremely impressive! (Try doing that yourself, by eye!) Pay attention to the ‘North” and “East” arrows. North is in the positive declination direction (degrees), and east is the positive right ascension direction (hours). Zoom in to your star, and then do a screen-snip and save it to some other app, and draw arrows showing exactly which star is the one you want, like I did here for my star, HAT-P-32. I also typed in its coordinates. This is for your own reference.
9. The next step is to have the computer compare the brightness of your selected star with a dozen or so comparison stars, and to do so in every frame (or ‘slice’ or ‘sub’), and show you the results in table (spreadsheet) form, and as a graph (chart) of the brightnesses over time of as many of the stars as you like. AIJ does this incredibly well, and incredibly quickly1 You don’t have to go frame by frame, measuring the brightness by eye of each and every single selected star, and noting any changes in brightness, by hand, as was done a century ago or so, in the days of photographic emulsions on thin glass plates. Here is a method for doing it in AIJ:
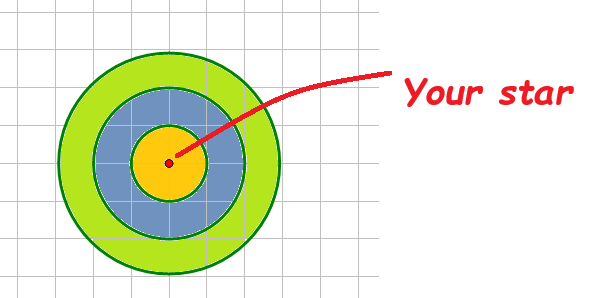
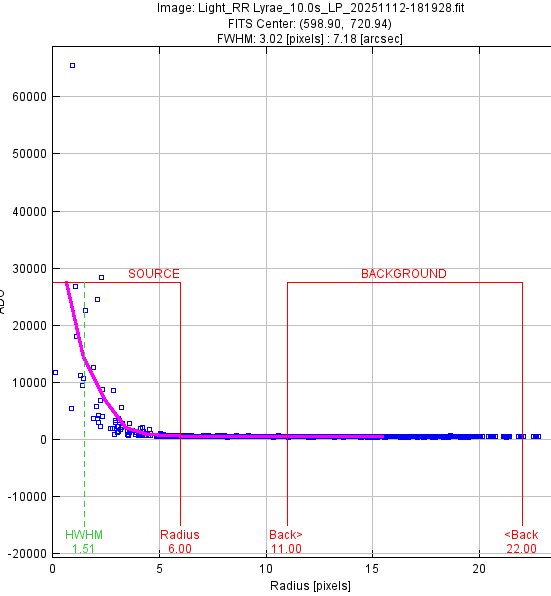
10. So what on earth is it doing, and how does it measure comparative brightness? My understanding is that it draws a three circles of increasing radii around each star, as I show here:
Basically, the software counts all the photons that it captures inside the first ring, which I labeled in yellow. It produces a number: the full width half max. Then it does the same thing for the photons in the outer ring, which it then assumes is the background brightness. I shaded this ring as olive green. It subtracts the FWHM for the yellow ring minus the FWHM of the green ring. It also compares those numbers for all of the comparison stars, and displays all the data in a variety of ways, including a spreadsheet and a graph.
11. Unfortunately, I found that I was unable to get AIJ to make very useful graphs, so I exported the entire spreadsheet into Excel and Google Sheets and made my graphs there.
Here is a link to a much better article on doing much the same thing:
I’d like to share these spectacular images of our Sun, taken by Prasad Agrahar with his home-made spectroheliograph.
His first image is at H-alpha (656 nm), second is at H-beta (486 nm), and the third is at Helium D3 (585 nm).
With this device, IIUC, he can make an image at just about any wavelength that makes it through the front lens of the optics. He posted this to the NCA email list.
DIY!!
Guy Brandenburg
Prasad wrote:
Here are three images of our Sun, taken on Thursday morning with my DIY spectroheliograph. The weather was quite windy, and the seeing was poor.
The above is H-alpha with [sunspot groups] AR 4294 and 4296 dazzling.
This is H-beta
And finally,
The above image is (…) Helium-D3, the emission line at 5875A.
Most (but not all) of the variable stars I tried over the past month or so were simply too bright for this sensor. The target stars were saturated (ie some of the pixels’ electron wells simply overflowed) despite using the shortest available exposure, adding the light pollution filter and refocusing. Seestar won’t let your change the ISO nor open the shutter for less than 10 seconds.
I did get some believable light curves on BE Lyncis (aka HD67390)and U Cephii (aka HD 5679). I attack some graphs I made.
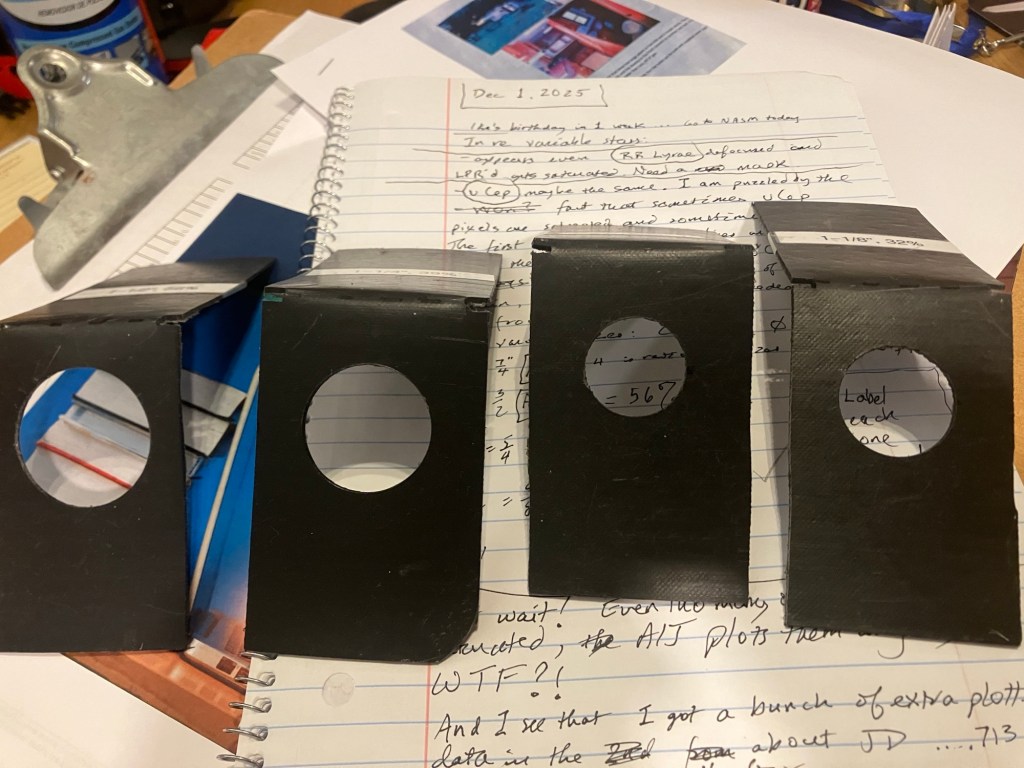
I used some black plastic I had,and my set of Forster bits, to make holes of sizes 1”, 1-1/8”, 1-1/4”, and 1-1/2”, in case I want to try brighter variable stars again like RR Lyrae.
I very impressed that Seestar absolutely nails the locations of every single one of these targets! I’m also pleased that AstroImageJ allows quick and easy plate-solving!
This graph gives me confidence that defocusing will solve my overflow problem. It’s a profile of the number of photons/electrons captured (vertical axis) versus the distance from what I thought was the exact center of the star RR Lyrae aka HD 182989.
(It is amazing how fast the computer works this out! I’m used to my middle school or high school students working things out like this by hand at first — it’s a very slow and tedious process! Let us give a tip of the hat to Williamina Fleming, who was the first person to notice and record that RR Lyrae was a variable star. She did so by examining glass plates on which were little dark spots made by stars’ light striking particles of suspended silver nitrate, without a blink comparator! Wow!)
Notice that there is one
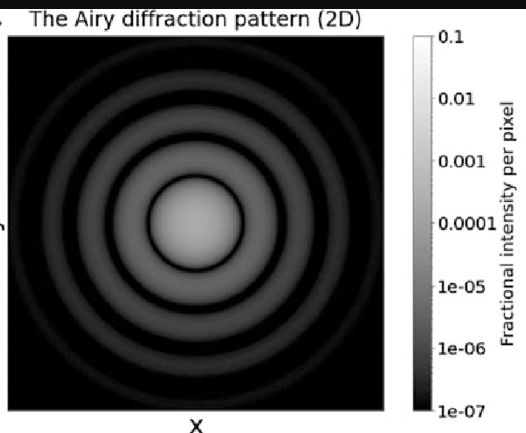
If I defocus the camera a bit, that saturated value would get spread out over an airy disk that might look like this: